Frequency Distribution


Frequency Distribution
Frequency:
The number of times a particular observation occurs in a given data is called its frequency of an observation.The observation having maximum frequency is known as mode.
Illustration: In a data 7,6,5,5,4,3,2,2,5,1,3 find the frequency of 5.
Solution: Here the frequency of 5 in this data is 3.
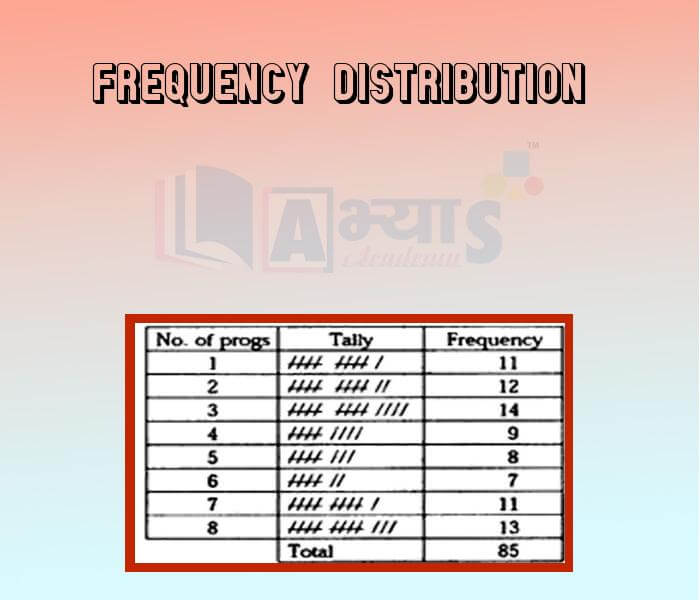
Frequency Distribution:
The tabular arrangement of data sharing their corresponding frequencies is called a frequency distribution. Frequency tells you how often something happened. The frequency of an observation tells you the number of times the observation occurs in the data.
The number of times a particular observation occurs in a given data is called ________________ | |||
| Right Option : B | |||
| View Explanation | |||
From the following frequency table, find out how many students failed if the pass marks are 40.
| |||||||||||||||||
| Right Option : D | |||||||||||||||||
| View Explanation | |||||||||||||||||
30 children were asked about the number of hours, they watched TV programs in previous week. The results are as follows: 1, 6, 2, 3, 5, 12, 5, 8, 4, 8 10, 3, 4, 12, 2, 8, 15, 1, 17, 6, 3, 2, 8, 5, 9, 6, 8, 7, 14, 12 . How many children watch TV less than 5 hours? | |||
| Right Option : D | |||
| View Explanation | |||
Students / Parents Reviews [20]
Being a parent, I saw my daughter improvement in her studies by seeing a good result in all day to day compititive exam TMO, NSO, IEO etc and as well as studies. I have got a fruitful result from my daughter.

Prisha Gupta
8thAbhyas is a complete education Institute. Here extreme care is taken by teacher with the help of regular exam. Extra classes also conducted by the institute, if the student is weak.

Om Umang
10thA marvelous experience with Abhyas. I am glad to share that my ward has achieved more than enough at the Ambala ABHYAS centre. Years have passed on and more and more he has gained. May the centre flourish and develop day by day by the grace of God.

Archit Segal
7thAbhyas institute is one of the best coaching institute in the vicinity of Ambala Cantt area. The teachers of the institute are well experienced and very helpful in solving the problems of the students.The good thing of the institute is that it is providing extra classes for the students who are w...

Aman Kumar Shrivastava
10thIt was good as the experience because as we had come here we had been improved in a such envirnment created here.Extra is taught which is beneficial for future.

Eshan Arora
8thAbout Abhyas metholodology the teachers are very nice and hardworking toward students.The Centre Head Mrs Anu Sethi is also a brilliant teacher.Abhyas has taught me how to overcome problems and has always taken my doubts and suppoeted me.

Shreya Shrivastava
8thMy experience with Abhyas is very good. I have learnt many things here like vedic maths and reasoning also. Teachers here first take our doubts and then there are assignments to verify our weak points.

Shivam Rana
7thI have spent a wonderful time in Abhyas academy. It has made my reasoning more apt, English more stronger and Maths an interesting subject for me. It has given me a habbit of self studying

Yatharthi Sharma
10thIn terms of methodology I want to say that institute provides expert guidence and results oriented monitering supplements by requsite study material along with regular tests which help the students to improve their education skills.The techniques of providing education helps the students to asses...

Aman Kumar Shrivastava
10thMy experience with Abhyas Academy has been very good. When I was not in Abhyas whenever teacher ask questions I could not speak it confidently but when I came in Abhyas, my speaking skills developed and now I am the first one to give the answer of teachers question.

Upmanyu Sharma
7thMy experience with Abhyas academy is very good. I did not think that my every subject coming here will be so strong. The main thing is that the online tests had made me learn here more things.

Hiya Gupta
8thWhen I have not joined Abhyas Academy, my skills of solving maths problems were not clear. But, after joining it, my skills have been developed and my concepts of science and SST are very well. I also came to know about other subjects such as vedic maths and reasoning.

Sharandeep Singh
7thThe experience was nice. I studied here for three years and saw a tremendous change in myself. I started liking subjects like English and SST which earlier I ran from. Extra knowledge gave me confidence to overcome competitive exams. One of the best institutes for secondary education.

Aman Kumar Shrivastava
10thOne of the best institutes to develope a child interest in studies.Provides SST and English knowledge also unlike other institutes. Teachers are co operative and friendly online tests andPPT develope practical knowledge also.

Aman Kumar Shrivastava
10thMy experience with Abhyas academy is very nice or it can be said wonderful. I have been studying here from seven class. I have been completing my journey of three years. I am tinking that I should join Abhyas Academy in tenth class as I am seeing much improvement in Maths and English

Hridey Preet
9thAbhyas is an institute of high repute. Yogansh has taken admission last year. It creates abilities in child to prepare for competitive exams. Students are motivated by living prizes on basis of performance in Abhyas exams. He is satisfied with institute.

Yogansh Nyasi
7thUsually we see institutes offering objective based learning which usually causes a lag behind in subjective examinations which is the pattern followed by schools. I think it is really a work of planning to make us students grab the advantages of modes of examination, Objective Subjective and Onli...

Anika Saxena
8thIt was a good experience with Abhyas Academy. I even faced problems in starting but slowly and steadily overcomed. Especially reasoning classes helped me a lot.

Cheshta
10thAbhyas is good institution and a innovative institute also. It is a good platform of beginners.Due to Abhyas,he has got knoweledge about reasoning and confidence.My son has improved his vocabulary because of Abhyas.Teacher have very friendly atmosphere also.

Manish Kumar
10thWe started with lot of hope that Abhyas will help in better understnding of complex topics of highers classes. we are not disappointed with the progress our child has made after attending Abhyas. Though need to mention that we expected a lot more. On a scale of 1-10, we would give may be 7.